Customer service metrics every store should track
Customer service metrics for small online stores: what to track, how to calculate each one, published benchmarks and a 20-minute weekly review.


Customer service metrics are the few numbers that show whether shoppers get fast, correct help, and whether that help turns into orders. A small online store needs eight of them: how fast you reply, how often you solve a problem the first time, how much your chat handles alone, how satisfied people are, and what support does for sales.
Getting this right matters more online. The European Commission’s 2025 Consumer Conditions Scoreboard found that online shoppers are over 60% more likely to run into problems than offline buyers, and that satisfaction with complaint resolution has declined.
Each metric below comes with a formula, a benchmark where a neutral one exists, and the place to find it, followed by a weekly review that takes about 20 minutes.
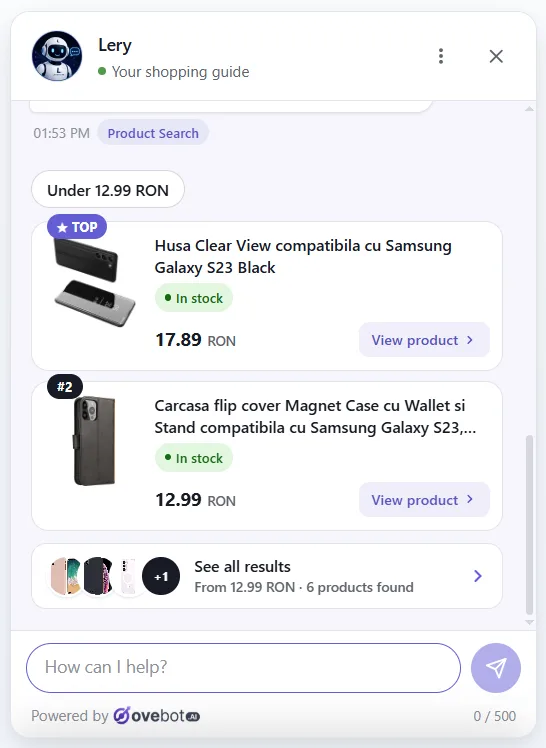
The screenshots show Ovebot on a demo store; market figures come from the sources listed at the end.
Key Takeaways
- Track a short list: first response time, first contact resolution (FCR), AI-resolved share, handoff rate, CSAT, contacts per order, chat-influenced sales and your most repeated questions.
- Published targets, such as “a common FCR target is 70-75%” (New York State), come from phone call centers. Use them as a starting point for chat, not a rule.
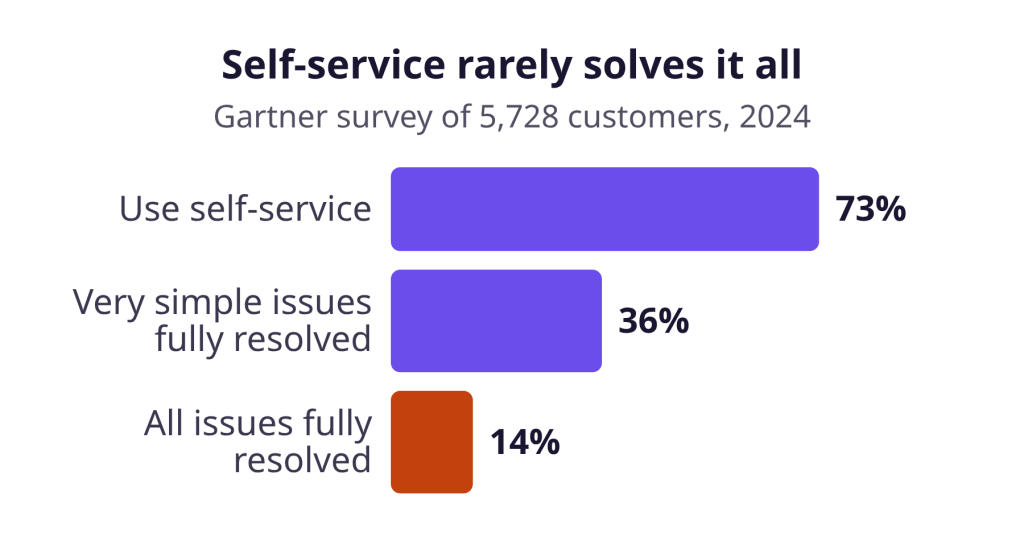
- Customers fully resolve only 14% of service issues in self-service, according to a 2024 Gartner survey, so read the conversations behind your AI numbers.
- Chat analytics count activity. Satisfaction (CSAT, NPS, customer effort) needs a short survey.
- Review the numbers weekly and fix the page or policy behind the weakest one.
Which problems turn into support questions?
Many support contacts trace back to a handful of problems shoppers run into: late deliveries, a site that doesn’t work, wrong or damaged goods, and rules that are hard to find. In 2025, 78% of EU internet users bought online, and 63% of them reported no issue. Among all online buyers, the most common problems were these:
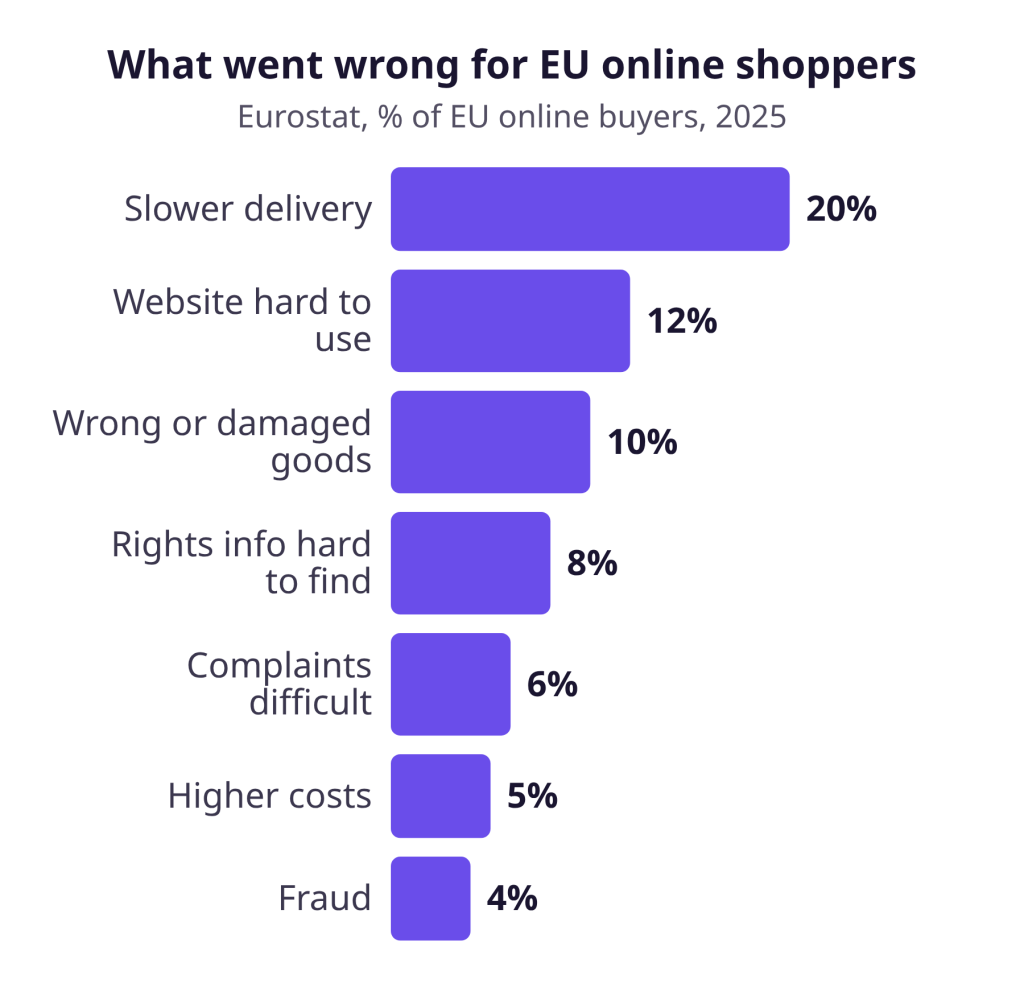
Each problem type becomes a question support must answer:
- Slow delivery: “Where is my order?” Watch contacts per order and response time.
- Website problems: “Checkout won’t accept my card.” Watch your repeated questions.
- Wrong or damaged goods: “I received the wrong size.” These need a person, so watch the handoff rate and FCR.
- Guarantee and rights information: “Can I still return this?” A repeated question here usually means a policy page is unclear.
Shoppers can ask these questions at any hour. Our guide to 24/7 customer support covers answering them outside office hours.
8 customer service metrics every store should track
Eight metrics cover speed, resolution, satisfaction and sales. You don’t need a data team, only a fixed period (one week) and the same method each time.
| Metric | How to calculate | Where to find it |
|---|---|---|
| First response time | Median time from first message to first reply, per week | Email or helpdesk timestamps, handed-over chats |
| First contact resolution (FCR) | Issues solved on first contact ÷ all issues × 100 | Tag the chats you read in the weekly review |
| AI-resolved share | Conversations solved without a person ÷ all conversations × 100 | Your chat tool’s report |
| Handoff rate | Conversations handed to a person ÷ all conversations × 100 | Chat conversation history |
| CSAT | Satisfied answers ÷ all answers × 100 | One-question survey after the contact |
| Contacts per order | Support contacts ÷ orders, same period | Inbox and chat sessions vs. store orders |
| Chat-influenced sales | Product clicks, add-to-carts, orders and revenue after a chat | Chat analytics with order tracking |
| Top repeated questions | The five most common questions of the week | Reading conversations |
Speed: first response time
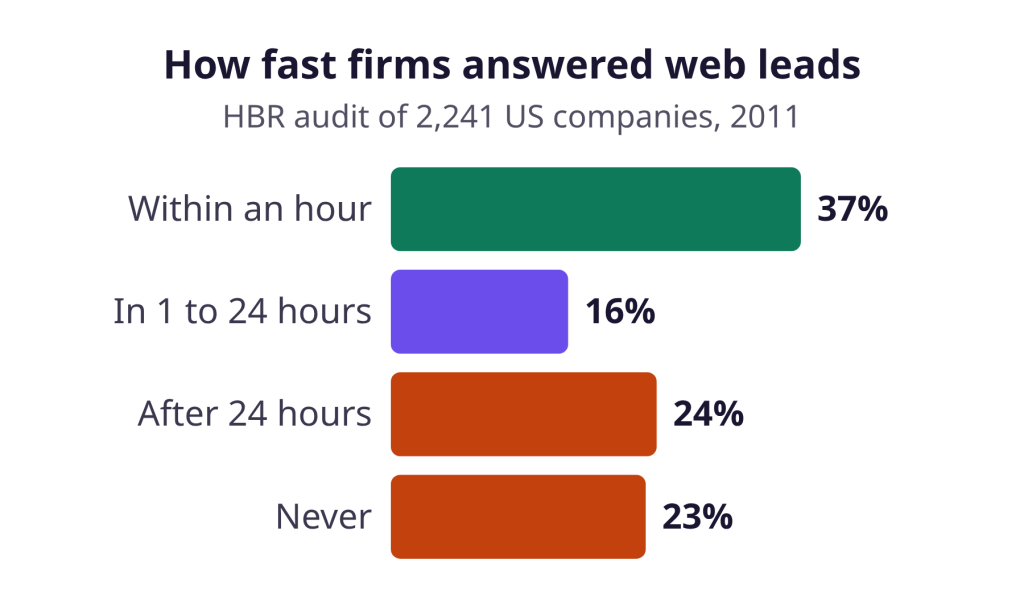
First response time is the wait before a shopper hears from you. No neutral study sets a chat or email benchmark for stores, so the clearest, if older, evidence comes from sales. In a 2011 Harvard Business Review audit of 2,241 US companies, firms that replied to a web lead within an hour were nearly 7 times as likely to qualify it as firms that waited one hour longer.
New York State’s call center standards aim to answer 80% of calls within 20-30 seconds, a phone norm. Our recommendation for a small store: answer email the same business day and pick up handed-over chats within minutes during working hours.
Resolution: FCR, AI-resolved share and handoff rate
First contact resolution (FCR) is the share of issues solved in the first contact. New York State’s call center standards note that “a common FCR target is 70-75%,” again for phone.
Your AI-resolved share deserves a careful reading. In a 2024 Gartner survey of 5,728 customers, reported by destinationCRM, 73% used self-service at some point, yet only 14% of issues were fully resolved there. In 43% of cases, customers couldn’t find content relevant to their issue.
The US Consumer Financial Protection Bureau warns that chatbot “effectiveness wanes as problems become more complex,” and that customers can get stuck in “doom loops.” A high AI-resolved share only counts when shoppers don’t come back with the same question. Read the handoff rate next to it: a sudden rise usually points to a missing answer, and a rate near zero can mean shoppers can’t reach a person. Our guides on chatbot-to-human handoff and why AI chatbots give wrong answers cover both cases.
Satisfaction: CSAT, NPS and customer effort
- CSAT comes from a post-contact survey. New York State notes that scores “often fall within the 80-90% range,” with above 90% considered exceptional.
- NPS, introduced by Reichheld in HBR in 2003, asks “How likely are you to recommend us to a friend or colleague?” on a 0-10 scale. Bain & Company calculates it as the percentage of promoters (9-10) minus the percentage of detractors (0-6).
- Customer effort, from Dixon, Freeman and Toman in HBR in 2010, asks how much effort it took to get the issue handled.
Pick one and keep it to a single question. CSAT suits a store best, because it rates a specific contact.
Sales: contacts per order and chat-influenced sales
Contacts per order show whether problems grow faster than sales. As an example, 60 contacts on 400 orders gives 0.15. If the ratio climbs while orders stay flat, look for a delivery or product problem.
Chat-influenced sales show the other side. Baymard Institute puts average cart abandonment at 70.22%, and slow delivery (20%) and unsatisfactory returns policies (13%) rank among the reasons. A shopper who gets those answers in chat may stay to buy. More on this in our cart abandonment guide.
For top repeated questions, note the topic of each chat you read and keep a running top five. A question that stays on the list points to a missing page or answer.
Which support numbers shouldn’t be goals?
Some customer service metrics look busy but don’t point to a fix. Treat these as context, never as goals:
- Total chat volume on its own. More chats can mean more interest or more problems. Divide by orders first.
- Average handle time (AHT). Phone centers typically see 4-6 minutes per contact, per New York State. In a small store, pushing AHT down can rush answers and bring the same shopper back.
- Messages per conversation. A long chat about choosing a laptop is good; a long chat about a lost parcel isn’t. Read the topic, not the count.
How to track these metrics in Ovebot
Ovebot gives you the activity side of your customer service metrics: volume, the split between AI and your team, product and cart events, and orders and revenue attributed to the chat. Satisfaction scores, FCR and response times still come from your survey and your own sampling.
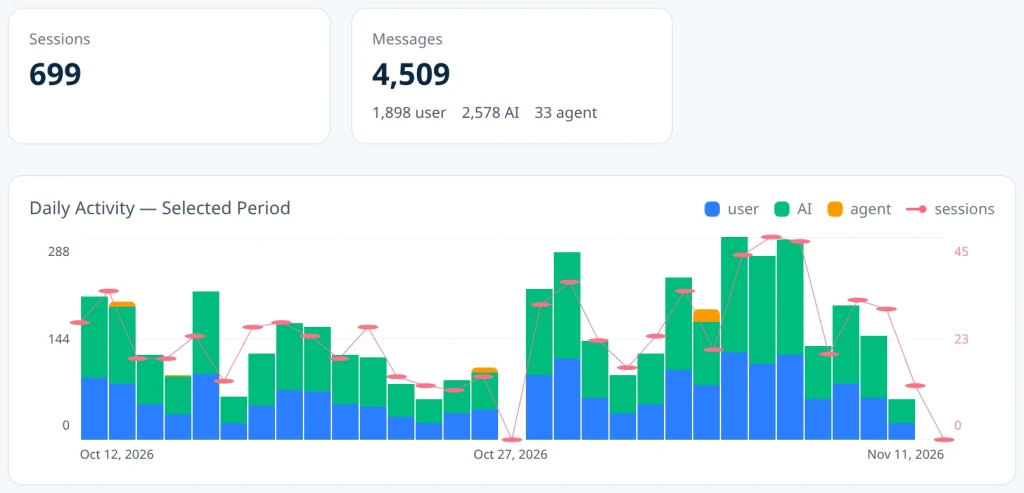
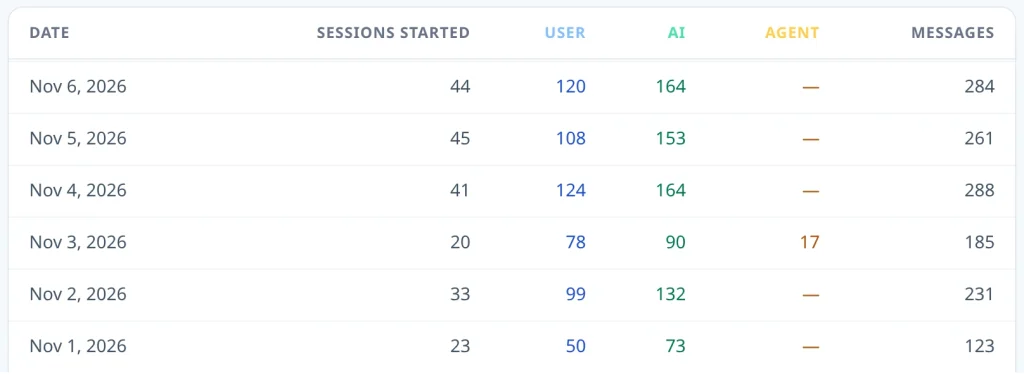
The message split is your starting point for handoff and AI share. On this demo store, 2,578 messages came from the AI against 33 from the team, a thin orange slice on a few days. For the handoff rate, open the conversation history for the days with agent messages, count the handed-over chats and divide by that week’s sessions (each session is one conversation).
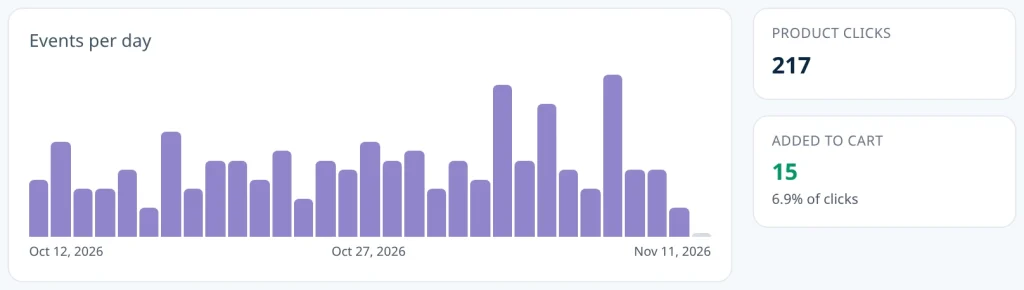
For the sales side, the Products tab counts product clicks and add-to-carts from chat recommendations, per product. Orders and revenue are attributed to the chat once you add the order tracking snippet.
Twice a month, an activity report arrives by email with a PDF: conversations, the share resolved by AI, support hours saved and orders influenced. That gives you the AI-resolved share twice a month; in the weeks between, use the message split. For repeated questions, agent memory helps: the agent proposes new facts it heard in chats, and you approve or reject each one.
For a small store that wants these numbers without a separate analytics setup, we recommend Ovebot. See the full feature list, install one of the official plugins, and try it with the 14-day free trial, no card needed. Chat data is stored in EU data centers, as described on the GDPR page.
A 20-minute weekly review routine
A short weekly look at your customer service metrics beats a monthly review, because problems stay small. Block 20 minutes on the same day each week.
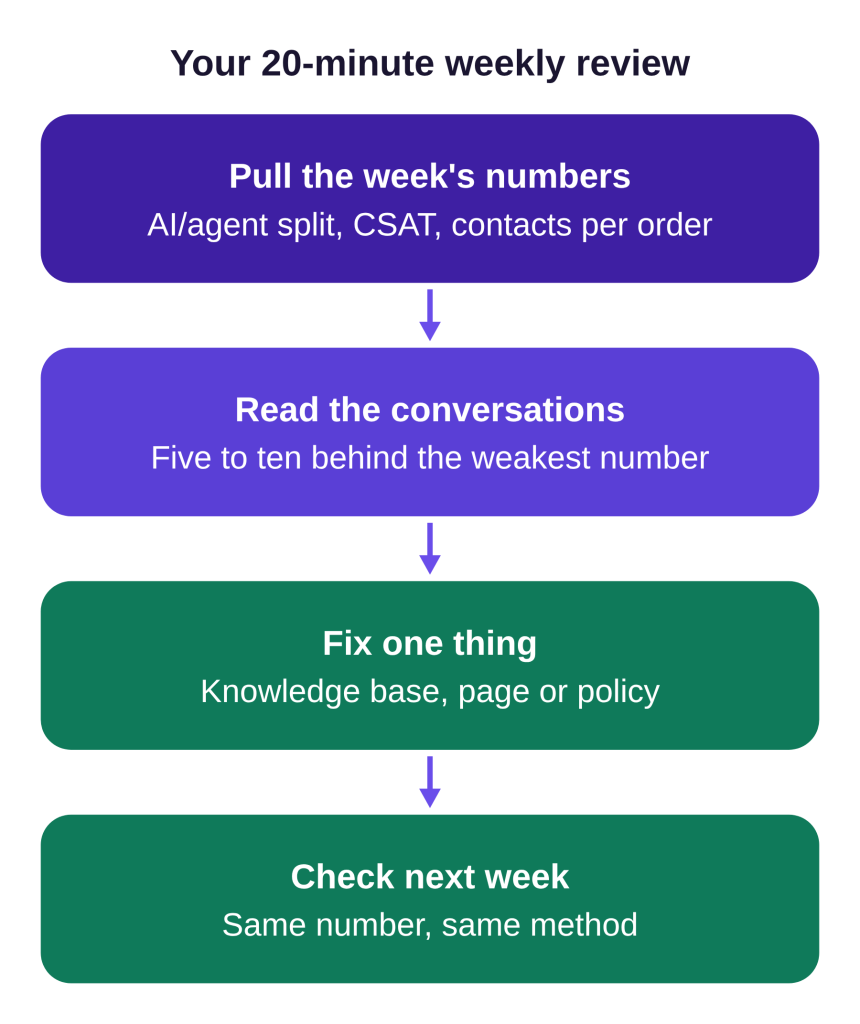
- Pull the numbers (5 minutes). Note sessions, the AI and agent message split, your CSAT responses and contacts per order.
- Read the conversations (10 minutes). Open five to ten chats from the weakest number, such as the days with handoffs.
- Fix one thing (5 minutes). Update a policy page, add a knowledge base entry or approve a proposed fact.
- Check next week. Compare the same number before you move on to a new one.
Frequently Asked Questions
What are the most important customer service metrics for a small online store?
Start with first response time, first contact resolution (FCR), CSAT and contacts per order. If you use an AI chat, add the AI-resolved share and the handoff rate. Then track chat-influenced sales, such as add-to-carts and attributed orders, and keep a weekly list of repeated questions. Eight numbers reviewed every week tell you more than thirty you never open.
How do I measure CSAT if my chat tool doesn’t?
Send one question after the conversation or with the order follow-up email: “How satisfied were you with the help you got?” on a 1-5 scale. Count answers of 4 and 5 as satisfied, divide by all answers and multiply by 100. If answers are linked to an email or order, handle them like any other customer data.
What’s the difference between CSAT, NPS and customer effort score?
CSAT rates one contact: were you satisfied with this help? NPS asks how likely someone is to recommend you on a 0-10 scale and reflects the whole relationship. Customer effort asks how much effort it took to get the issue handled. For a small store, CSAT is the easiest to act on, because each score points to a specific conversation.
Bottom line: a few numbers, read every week
Customer service metrics only help when they lead to a fix. Track the eight that fit your store, compare them with phone norms carefully, and spend your weekly 20 minutes reading the conversations behind the weakest number.
Sources
- Eurostat, E-commerce statistics for individuals, 2025 data (extracted February 2026)
- European Commission, 2025 Consumer Conditions Scoreboard, 2025
- destinationCRM, Only 14% of Customer Service Issues Are Fully Resolved in Self-Service (Gartner survey), 2024
- Oldroyd, McElheran and Elkington, The Short Life of Online Sales Leads, Harvard Business Review, 2011
- New York State, Call Center Standards, accessed 2026
- Bain & Company, Measuring Your Net Promoter Score, accessed 2026
- Reichheld, The One Number You Need to Grow, Harvard Business Review, 2003
- Dixon, Freeman and Toman, Stop Trying to Delight Your Customers, Harvard Business Review, 2010
- Consumer Financial Protection Bureau, Chatbots in consumer finance, 2023
- Baymard Institute, Cart abandonment rate statistics, 2006-2025 studies
This article was written with the help of artificial intelligence and reviewed by a human editor.